Table of Contents
Grading Curve
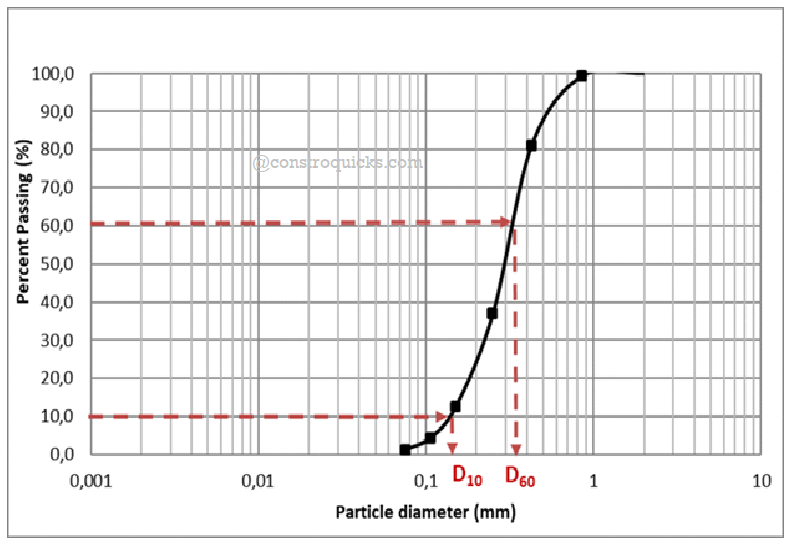
The graphical representation of sieve analysis is also knows as Grade curve.
1. Readings recorded from sieve analysis is plotted in graph shown below (take particle size on X-axis and percent finer on Y-axis). This graph is also known as Grading Curve.
2. With respect to this graph 10%, 30% and 60% finer, and dimeter from graph is also designated as D10, D30 and D60
3. Calculate the Coefficient of uniformity (Cu)and Coefficient of curvature (Cc) by using following equations,
Cu = D60/ D10
Cc = D230/ (D60 x D10)
To know more about sieve analysis>>>
Uniformity Coefficient (Cu):
- · The Uniformity coefficient is express as the ratio of D60 to D10.
- · Where D60 is the value where the particle size of aggregates are 60% finer and 40% are coarser.
- · And D10 is the value where the particle size of aggregates are 10% finer and 90% are coarser.
- · And Cu is calculated as, Cu = D60/ D10
- · If Cu is greater than 4: Soil is classified as well graded
- · If Cu is less than 4: Soil is classified as poorly/unifromly graded
Coefficient of Curvature (Cc):
- · The coefficient of curvature is express of D30, D60 and D10.
- · Where D30 is the value where the particle size of aggregates are 30% finer and 70% are coarser.
- · D60 is the value where the particle size of aggregates are 60% finer and 40% are coarser.
- · And D10 is the value where the particle size of aggregates are 10% finer and 90% are coarser.
- · And Cc is calculated as,

- · If Cc is between 1 to 3: Soil is classified as well graded
- · If Cu and Cc is equal to 1: Soil is classified as single sized soil mass.