Table of Contents
Based On (IS : 2386 (Part 1) and IS : 2386 (Part 4))
- The Sieve analysis test is nothing but the gradation test, in which gradation of particle (distribution of aggregates by size, within given sample) is find out.
- The gradation is also required to find out suitability of aggregates for construction, its strength and durability.
- Depend on the gradation or sieve analysis of aggregates, classification of aggregates is there. Click here to read more>>>
Also read: Properties of aggregates>>>
Also read: Types of aggregates>>>
Also read: How to select the aggregates for construction>>>
Also read: Grading of aggregates>>>
Objective:
To find out the particle size distribution of fine aggregates, coarse aggregates and all in aggregates by sieving or screening the sample aggregates.
Sieve Analysis Test procedure (IS : 2386 (Part 1) and IS : 2386 (Part 4))
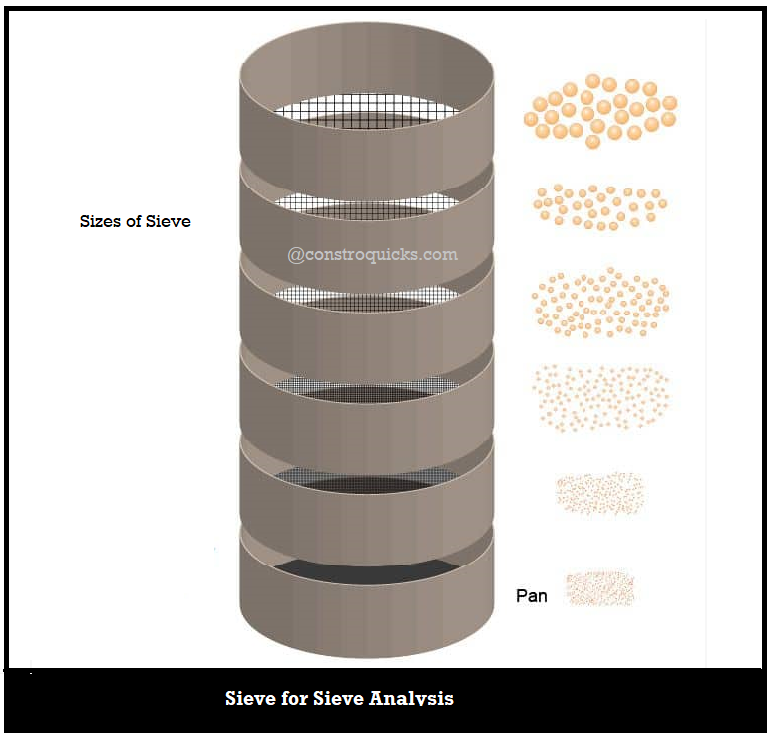
Apparatus:
- Different type of sieves (As per IS standards)
- Weighing Balance (Accuracy upto 0.01gm)
- Mechanical Sieve shaker
- Oven
Note: Sieve sizes are different for coarse aggregate and fine aggregates.
Procedure:
Following steps are need to follow for sieve analysis:
- Take the aggregates sample of exact 1kg by weighing it. (Make sure that all aggregates should be oven dried before measurement) and note down the measurement as W1 (1kg or 1000gm)
- If the particles are lumped then crush the lumps with hand or pestle.
- Weigh all the empty sieves and record their weight in gms.
- Prepare the all sieves for testing by dusting all. And stack them all together with respect to their size. Note that the largest sieve size should be at top and smallest at bottom by arranging them in descending order, it shall collect the sieved samples from above sieve.
- Place the sample(W1), in top most sieve close the lid, pack the sieve stacker by fixing the clamps.
- And start mechanical sieve shaker for 10 to 15 minutes. And switch it off after the rotating period.
- Unpack the all sieves and measure the mass of each sieve to find out the weight of retain aggregates on each sieve.
- Calculate the wright of retained material on each sieve by subtracting the empty weight of that particular sieve.
- Analysis the all readings. Make sure that sum of all retained material should be equal to weight of sample taken.
Precautions and measures:
- Test sieve should be clean before and after test with help of metal paint brush to avoid the errors. It should be well maintained.
- Excessive brushing to sieve also damage the sieve, so avoid brushing the sieve mess finer than 150 microns. But maintain the cleanliness of all sieves.
- Maintain all the sieve after use. Make sure all sieve should be clean and free from dust particles.
- Replace the sieve if found damaged. Or after certain time period, replace all sieves to avoid the damage due to corrosions.
- Store the sieve in dry and clean environment to avoid the damage to sieve by corrosion.
Data Recording and Calculation:
- Sample Details:______________
- Sample weight taken(W): __________gms
- Day & date:_______
- Time:______________
Table for Sieve analysis Reading Reference: (Fine Aggregates only)
| Sr. No. | Sieve Size | Weight of sieve (gm) | Weght of sieve + weight retained (gm) | Weight Retained (gm) | Cumulative weight retained (gm) | Percentage weight retained | Percentage weight passing |
| A | B | C = B-A | (C/W) x100 | ||||
| 1 | 4.75 mm | ||||||
| 2 | 2.36 mm | ||||||
| 3 | 1.18 mm | ||||||
| 4 | 600 microns | ||||||
| 5 | 300 microns | ||||||
| 6 | 150 microns | ||||||
| 7 | 75 microns | ||||||
| 8 | Pan |
Reporting of Result:
The result ( Sieve analysis of aggregates lab report) should be calculated as above and reported as follows,
1. Cumulative percentage of total sample by weight passing to each sieve to nearest number (whole number)
2. Percentage of total sample retained on each sieve by weight passing to each sieve to nearest number (whole number)
Graphical method of recording Result for Sieve analysis:
1. Plot the graph log of all the readings recorded in table as shown in graphs. ( take particle size on X-axis and percent finer on Y-axis). This graph is also known as Grading Curve.
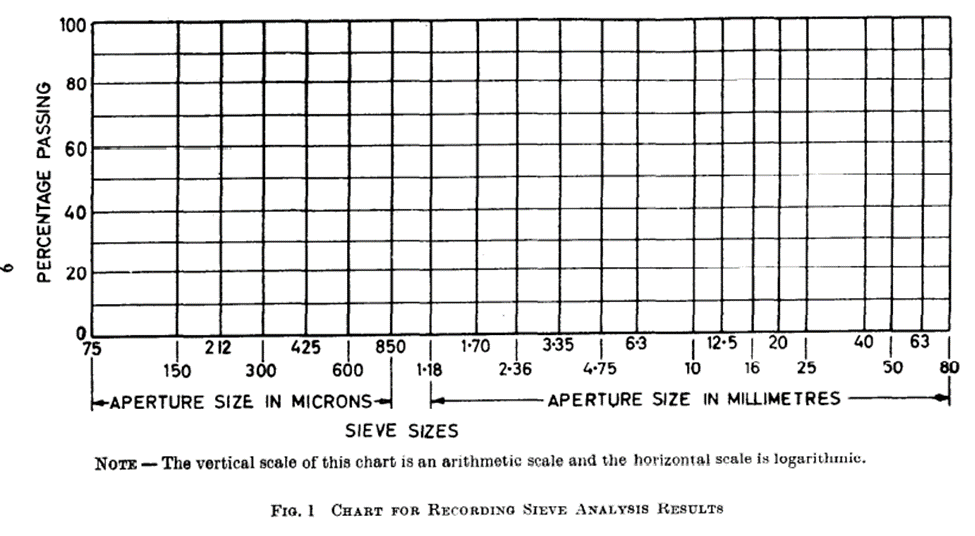
2. With respect to this graph 10%, 30% and 60% finer, and dimeter from graph is also designated as D10, D30 and D60
3. Calculate the Coefficient of uniformity (Cu)and Coefficient of curvature(Cc) by using following equations,
Cu = D60/ D10
Cc = D230/ (D60 x D10)
